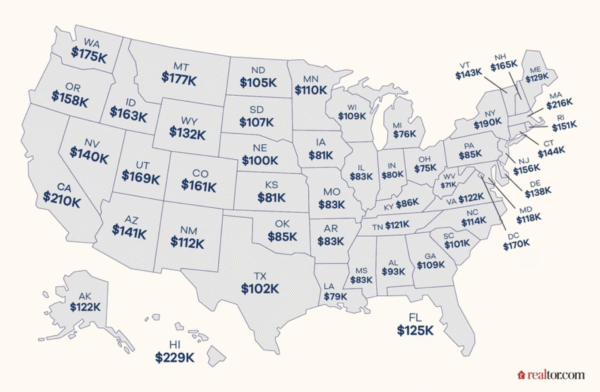
How Much a Family of 4 Needs to Afford a Home by State
Nationwide, the income needed to buy a home is, on average, 73% higher than what most families actually earn.
Let’s break it down. The NAR article (https://www.realtor.com/news/trends/family-income-to-buy-home-by-state-map/) compared the median price to the median income of a four person household. I feel the median family income is better to use, so I used the Wise Voter data in the table below. Comparing these 2 data sets, the price to purchase a home is, on average, 73% higher than the median family income.
Affordable Housing Statistics (State by State):
| State | Required Income to get a Loan | Median Family Income | Required Income Increase |
|---|---|---|---|
| Alabama | $92,583 | $56,929 | 63% |
| Alaska | $121,585 | $81,133 | 50% |
| Arizona | $140,578 | $70,821 | 98% |
| Arkansas | $83,440 | $50,784 | 64% |
| California | $209,643 | $81,575 | 157% |
| Colorado | $161,002 | $84,954 | 90% |
| Connecticut | $143,729 | $80,958 | 78% |
| Delaware | $137,986 | $68,687 | 101% |
| Florida | $125,182 | $59,734 | 110% |
| Georgia | $109,354 | $61,497 | 78% |
| Hawaii | $229,341 | $82,199 | 179% |
| Idaho | $163,153 | $76,918 | 112% |
| Illinois | $83,440 | $79,253 | 5% |
| Indiana | $80,418 | $70,190 | 15% |
| Iowa | $80,562 | $72,429 | 11% |
| Kansas | $80,662 | $75,979 | 6% |
| Kentucky | $86,044 | $55,629 | 55% |
| Louisiana | $79,138 | $57,206 | 38% |
| Maine | $129,340 | $71,139 | 82% |
| Maryland | $117,505 | $97,332 | 21% |
| Massachusetts | $215,816 | $86,566 | 149% |
| Michigan | $76,361 | $64,488 | 18% |
| Minnesota | $109,627 | $80,441 | 36% |
| Mississippi | $83,426 | $46,637 | 79% |
| Missouri | $83,167 | $63,594 | 31% |
| Montana | $176,513 | $64,999 | 172% |
| Nebraska | $99,836 | $78,109 | 28% |
| Nevada | $139,742 | $64,340 | 117% |
| New Hampshire | $165,456 | $88,841 | 86% |
| New Jersey | $156,822 | $88,559 | 77% |
| New Mexico | $112,146 | $53,463 | 110% |
| New York | $189,923 | $72,920 | 160% |
| North Carolina | $114,951 | $62,891 | 83% |
| North Dakota | $104,555 | $68,882 | 52% |
| Ohio | $74,663 | $62,689 | 19% |
| Oklahoma | $84,892 | $60,096 | 41% |
| Oregon | $158,276 | $81,855 | 93% |
| Pennsylvania | $85,397 | $72,627 | 18% |
| Rhode Island | $151,067 | $74,982 | 101% |
| South Carolina | $101,426 | $62,542 | 62% |
| South Dakota | $107,196 | $73,893 | 45% |
| Tennessee | $120,855 | $62,166 | 94% |
| Texas | $102,160 | $67,404 | 52% |
| Utah | $168,693 | $87,649 | 92% |
| Vermont | $143,168 | $76,079 | 88% |
| Virginia | $121,534 | $80,268 | 51% |
| Washington | $174,700 | $87,648 | 99% |
| West Virginia | $71,080 | $46,836 | 52% |
| Wisconsin | $109,196 | $69,943 | 56% |
| Wyoming | $132,297 | $71,052 | 86% |
The least affordable states for the average family are California, Hawaii, Massachusetts, New York, and Montana.
The most affordable are South Dakota, Minnesota, Illinois, Indiana, Iowa, Michigan, Pennsylvania, Ohio, Oklahoma, Nebraska, Missouri, and Kansas.
It’s no surprise that affordability varies by region. But it’s worth paying attention to where the math actually works. The Midwest, the “so called” fly-over states, may not always be flashy, but the fundamentals are strong.