Rental Market Update: Q2 2025 Trends and Insights
As of Q2 2025, the rental Market is Softening — but it’s not what we’d consider a traditionally “soft” market. This is more of a return to pre-pandemic norms after years of tighter-than-usual conditions.
Whether you entered the industry in the last five years and are seeing these conditions for the first time or you’ve been doing this since before cell phones, now is a great time to double down on efficiency as margins tighten. Here’s a look at the data behind the big-picture trend and some tips on how you can adapt into a more efficient organization.
What the Data Shows: 4 Signs It’s a Tenants’ Market
1. Time on market trending up
The first signal we’re seeing is that time on market is trending up (in rural, suburban, and urban locations). From January 2022 to January 2025, the average time on market nearly doubled. The median in Q1 was 32 days, and the average time on market was 41 days (Figure 1).
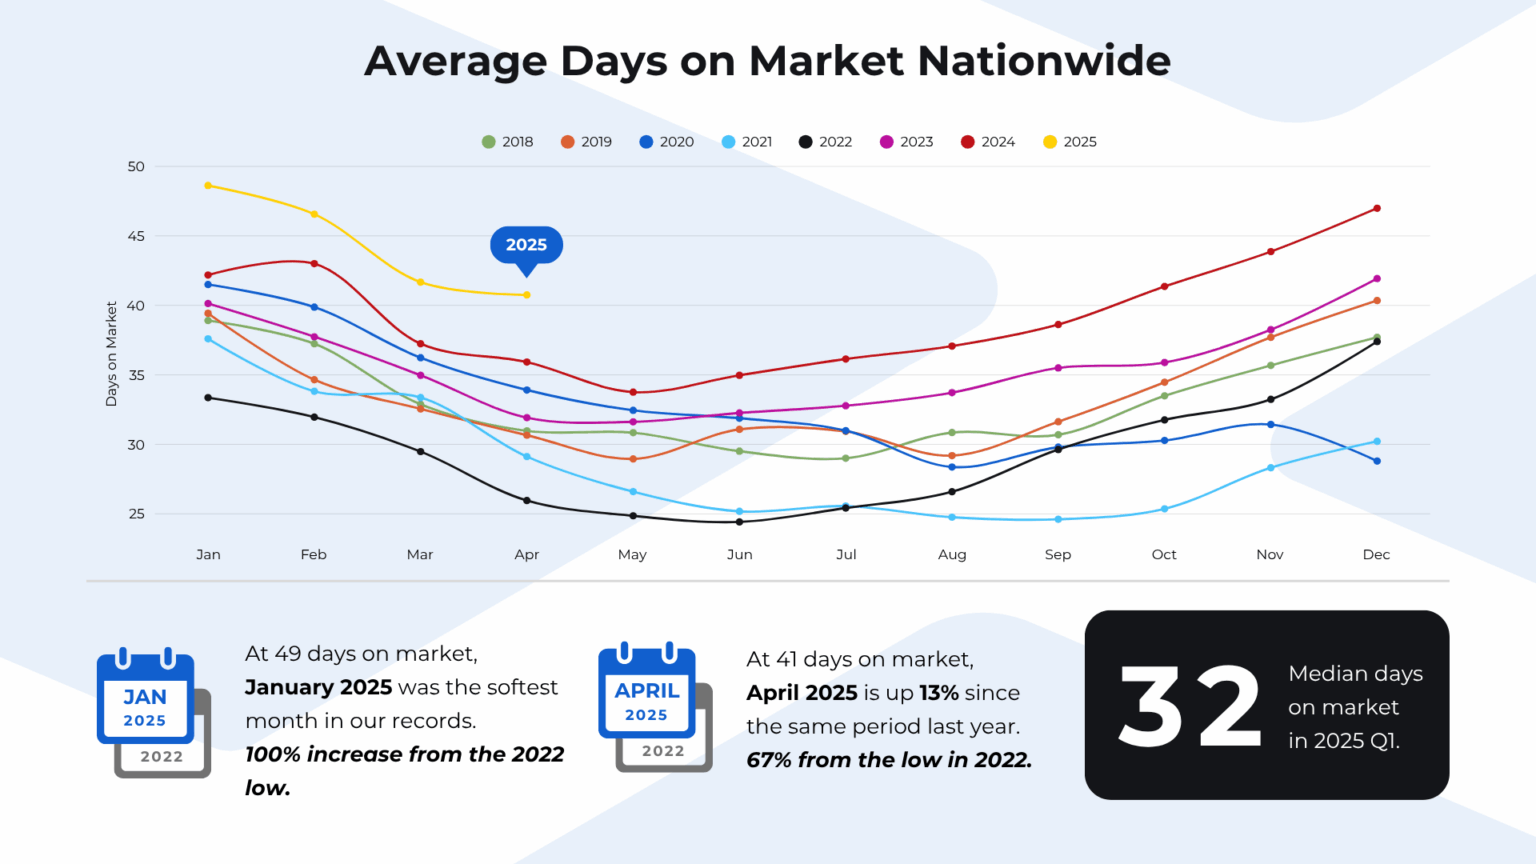
Figure 1: Average days on market nationwide, 2018 – 2025
2. Leads per rental near historic lows
The second signal is that we’re seeing fewer leads per rental. In 2021 and 2022, when the market was at its tightest, we saw highs of near 30 leads per rental. Now, property managers are seeing fewer than 22 leads per unit (Figure 2).
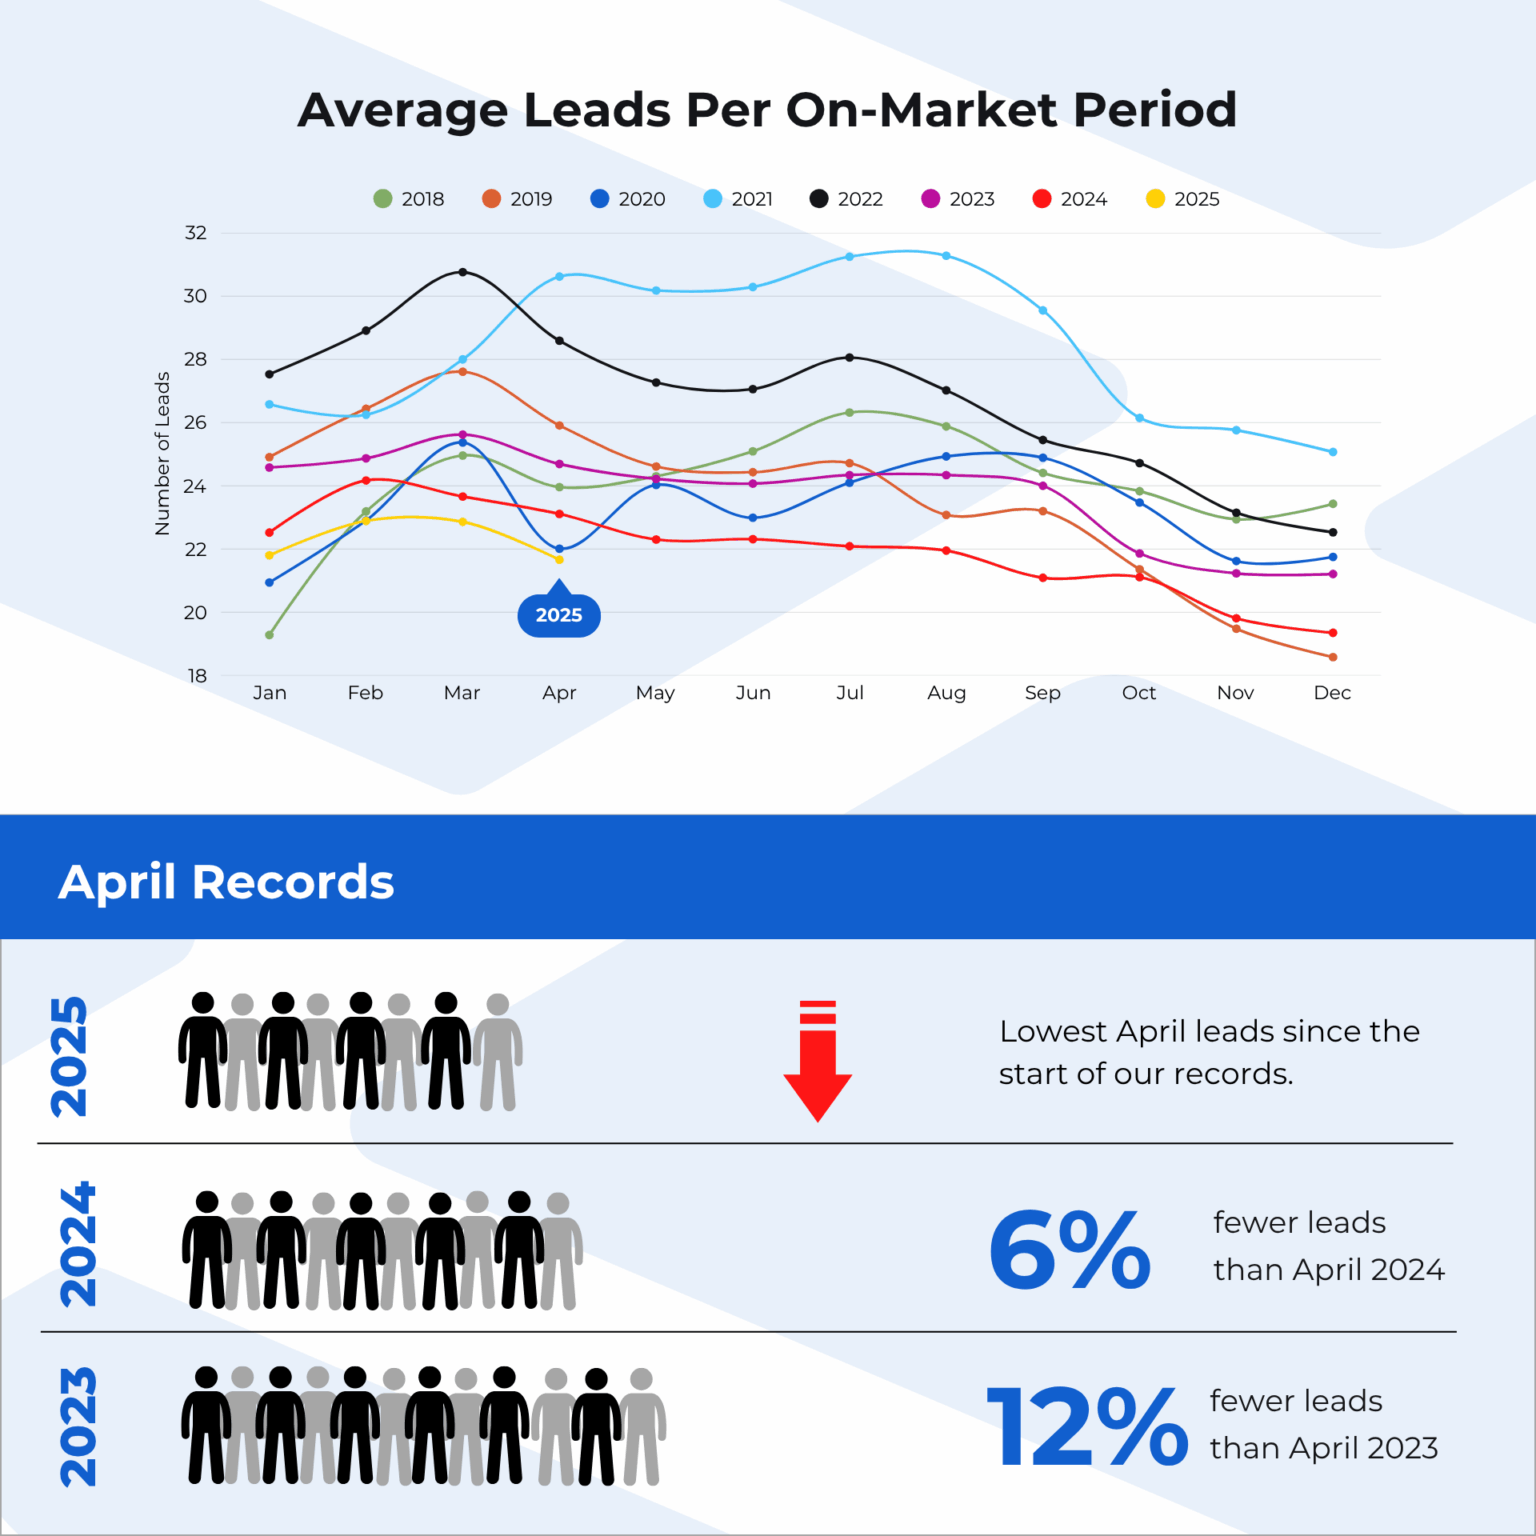
Figure 2: Leads per on-market period, 2018 – 2025
3. Concessions are increasing
Among the most notable concessions we’re seeing is a rise in allowing pets. Year over year, there was a 5.6% increase in units allowing pets (Figure 3). This trend demonstrates that landlords are becoming increasingly open to tenants’ needs and wants versus their own risk tolerance for pets – again, signaling a tenants’ market.
But it’s not enough to allow pets; being clear about your pet policy is also important, as we’ll note in the next data point.
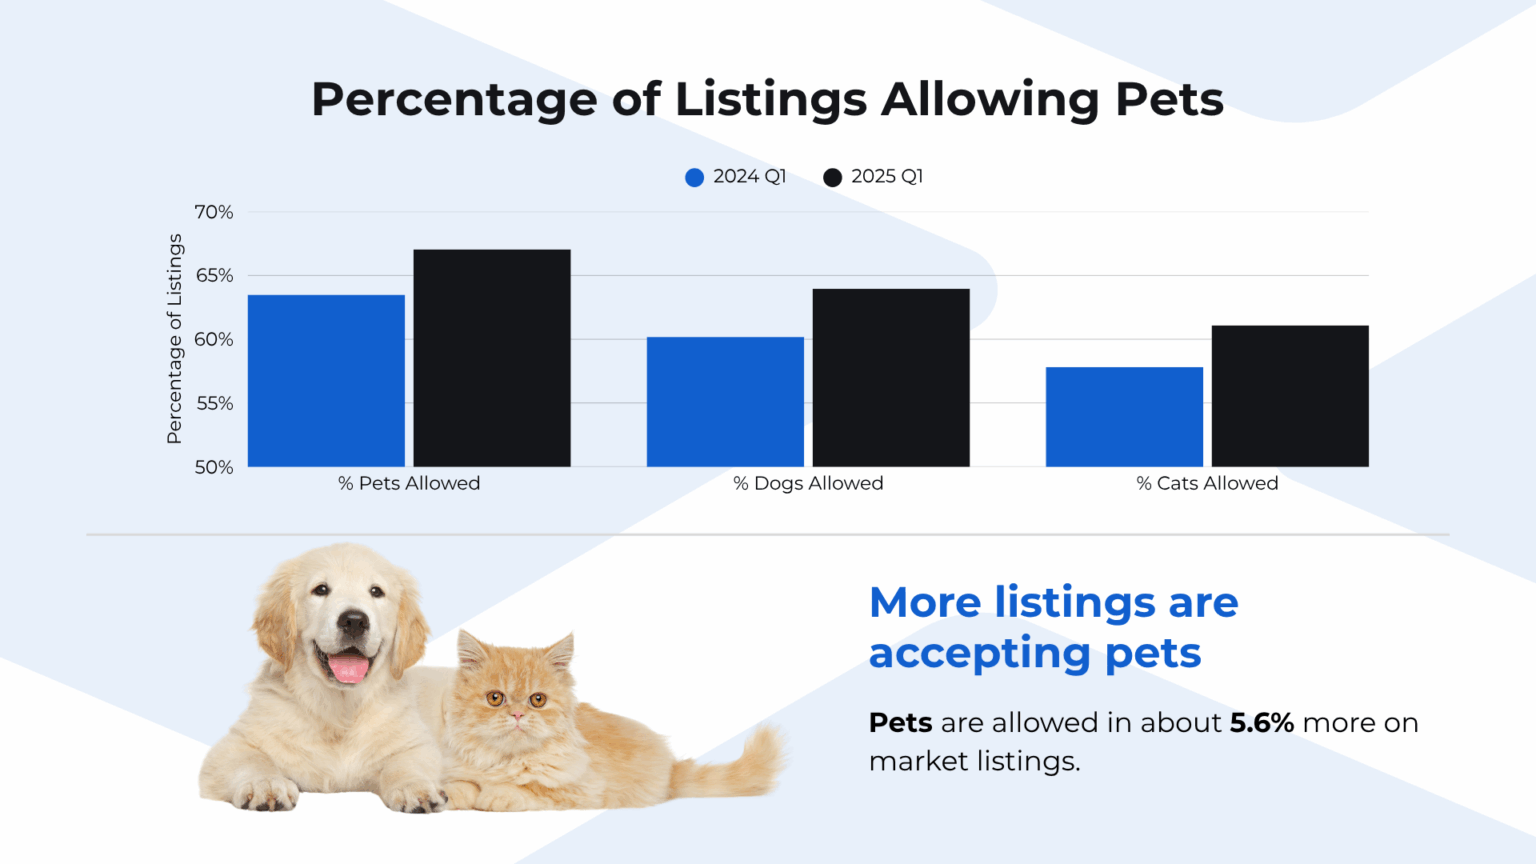
Figure 3: More listings are allowing pets in Q1 2025 than in Q1 2024
4. Penalties for unclear policies
When tenants have more power, they’re more likely to skim past confusing listings. We’re starting to see a days-on-market penalty for listings that don’t have clear policies for pets (Figure 4), security deposit (Figure 5), and application process.
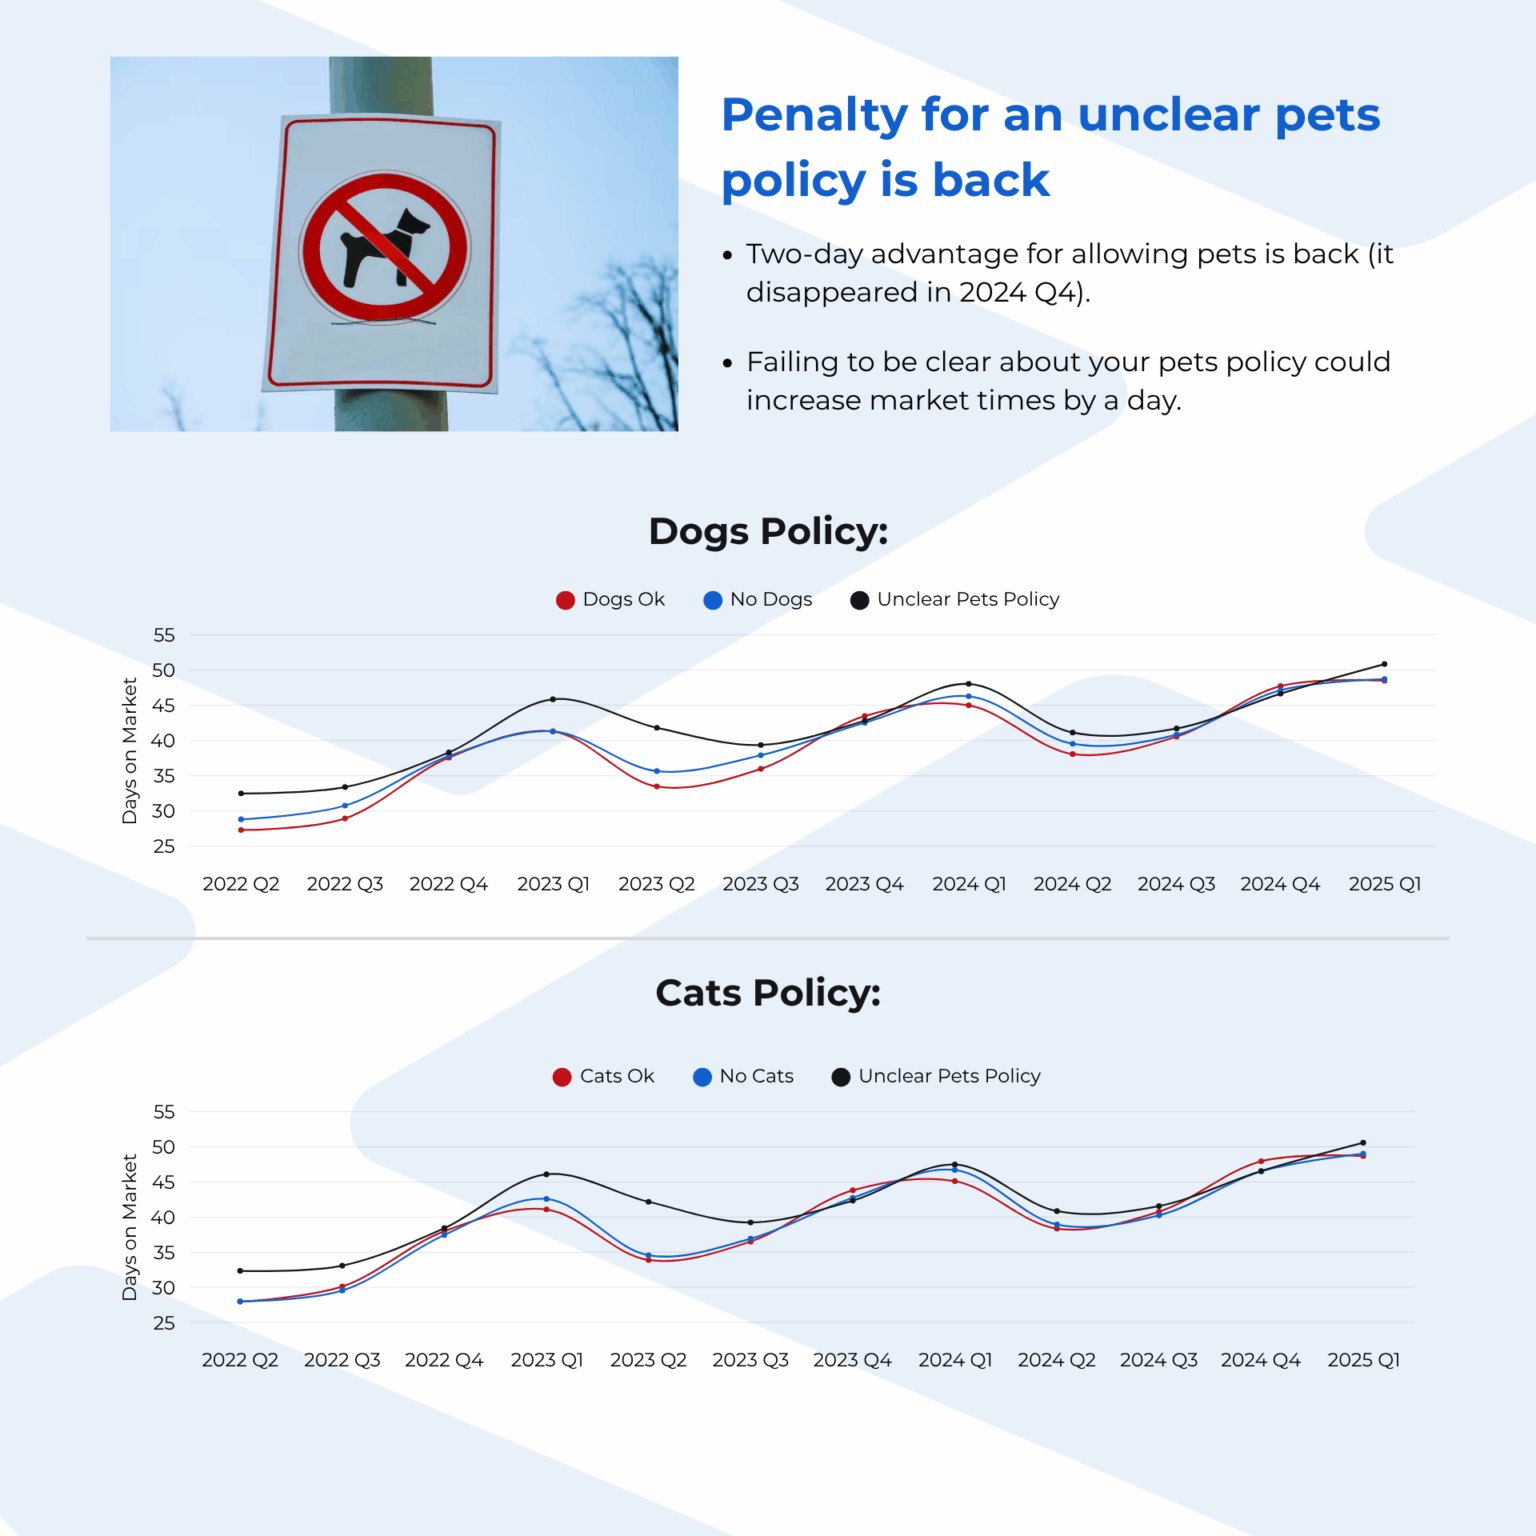
Figure 4: Units without a clear pets policy take longer to rent
Put differently: if you’re not spelling out what renters can expect, you can expect it to be harder to fill units. Transparency is key as it cuts down the back and forth with renters, resulting in a faster time to lease.
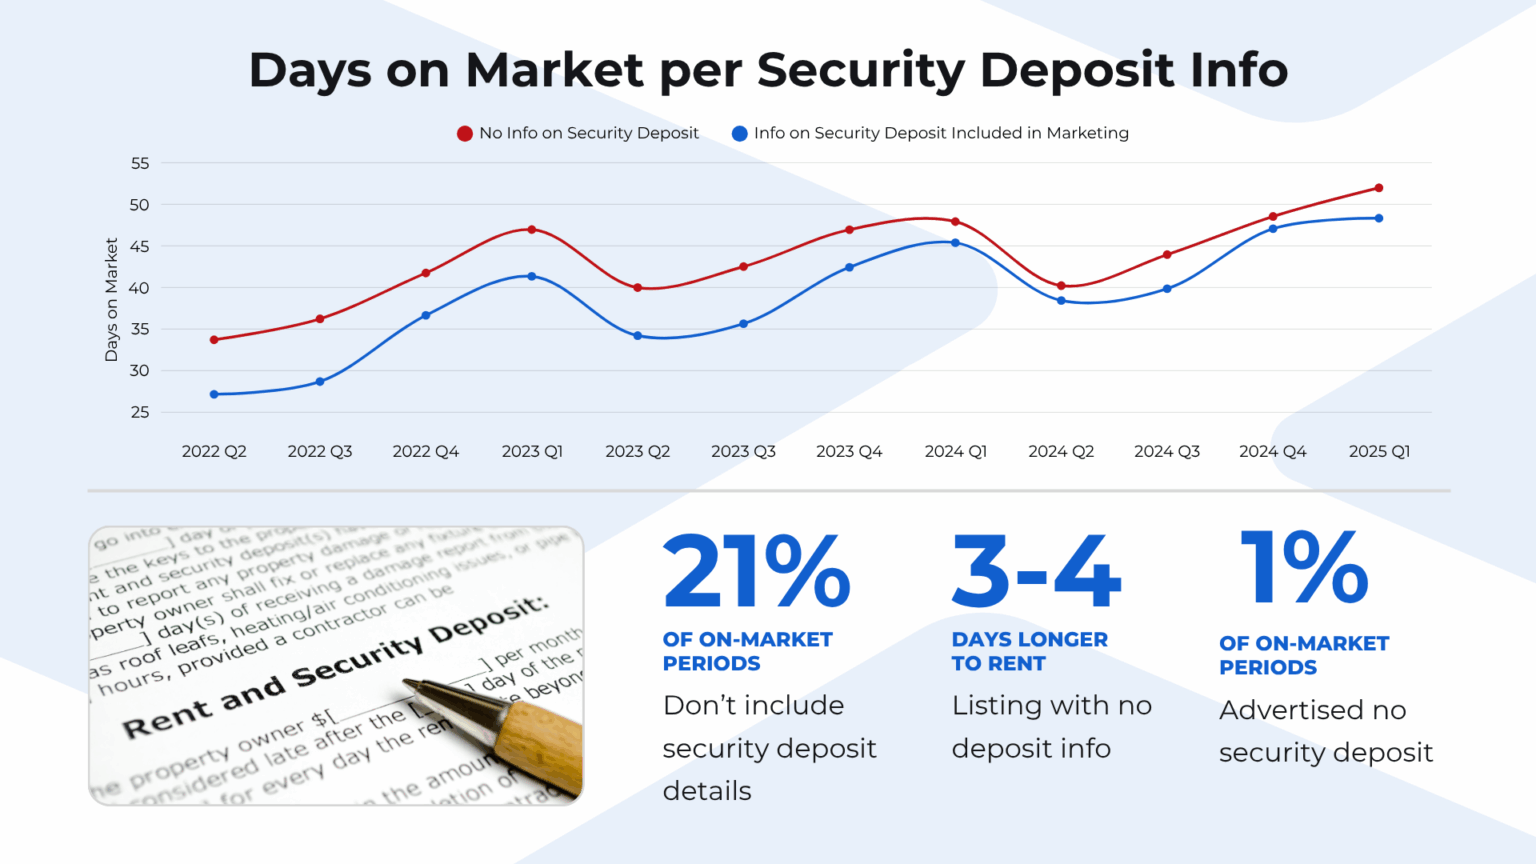
Figure 5: Units with an unclear security deposit policy take longer to rent
But it’s not all bad news for property managers.
Rents Continue to Climb
One big reason we’re reading this softening as more of a return to normal than a true softening is that there just aren’t enough housing units on the market. There aren’t enough being built and there haven’t been since 2008.
As a result, rents are still rising. Three key data points tell this story:
Lower-priced rents ($500–$999) are declining as a share of total available units (Figure 6).
Listings above $1,500 are leasing faster than less expensive units.
Median rents are rising nationwide. As of April, we saw the nation’s highest median rent on file (Figure 7).
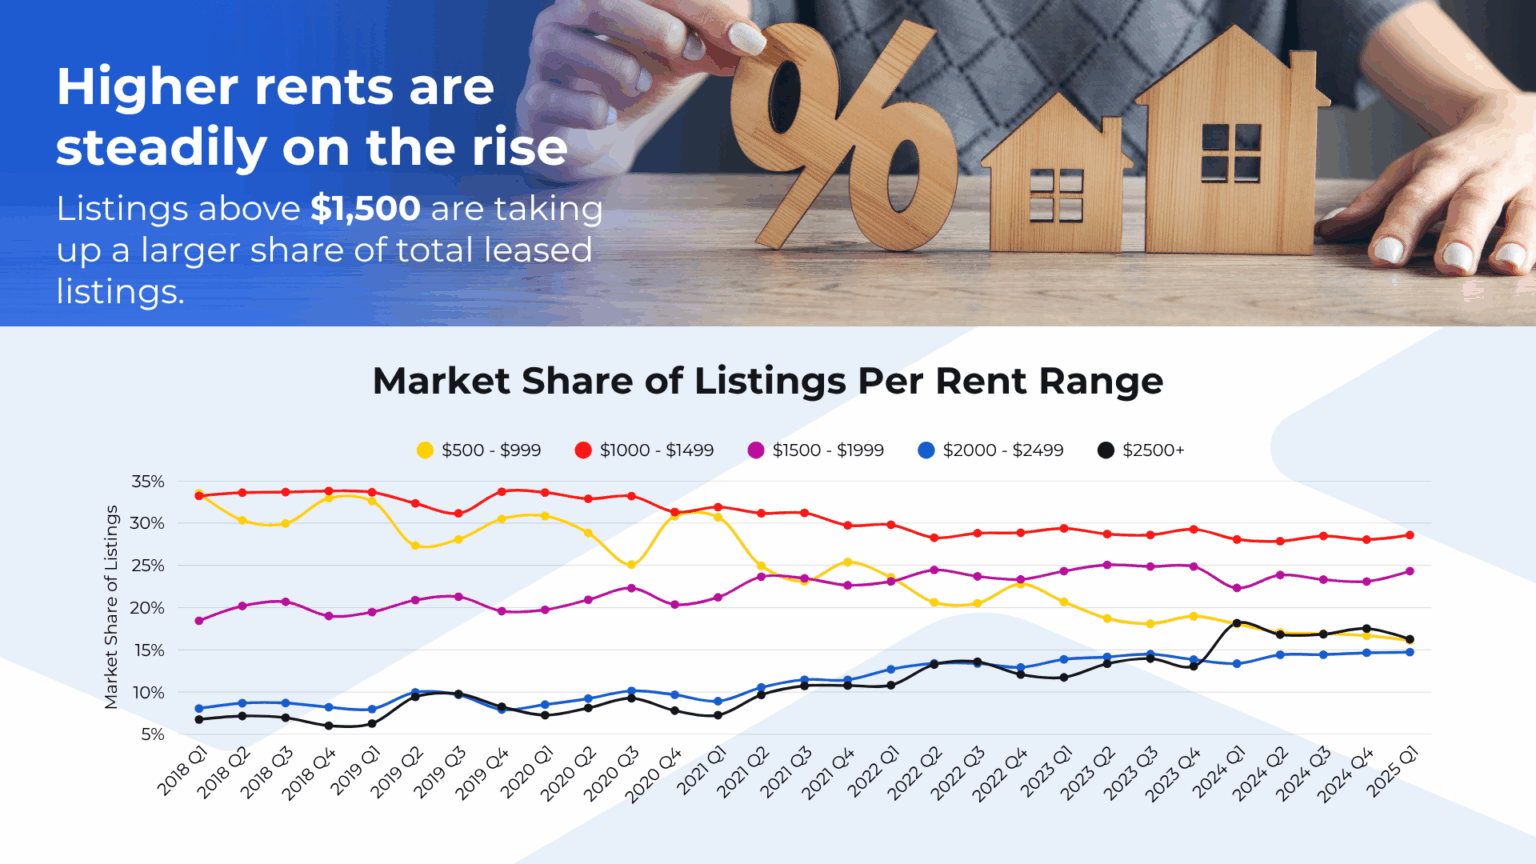
Figure 6: We’re seeing fewer units priced from $500 – $999
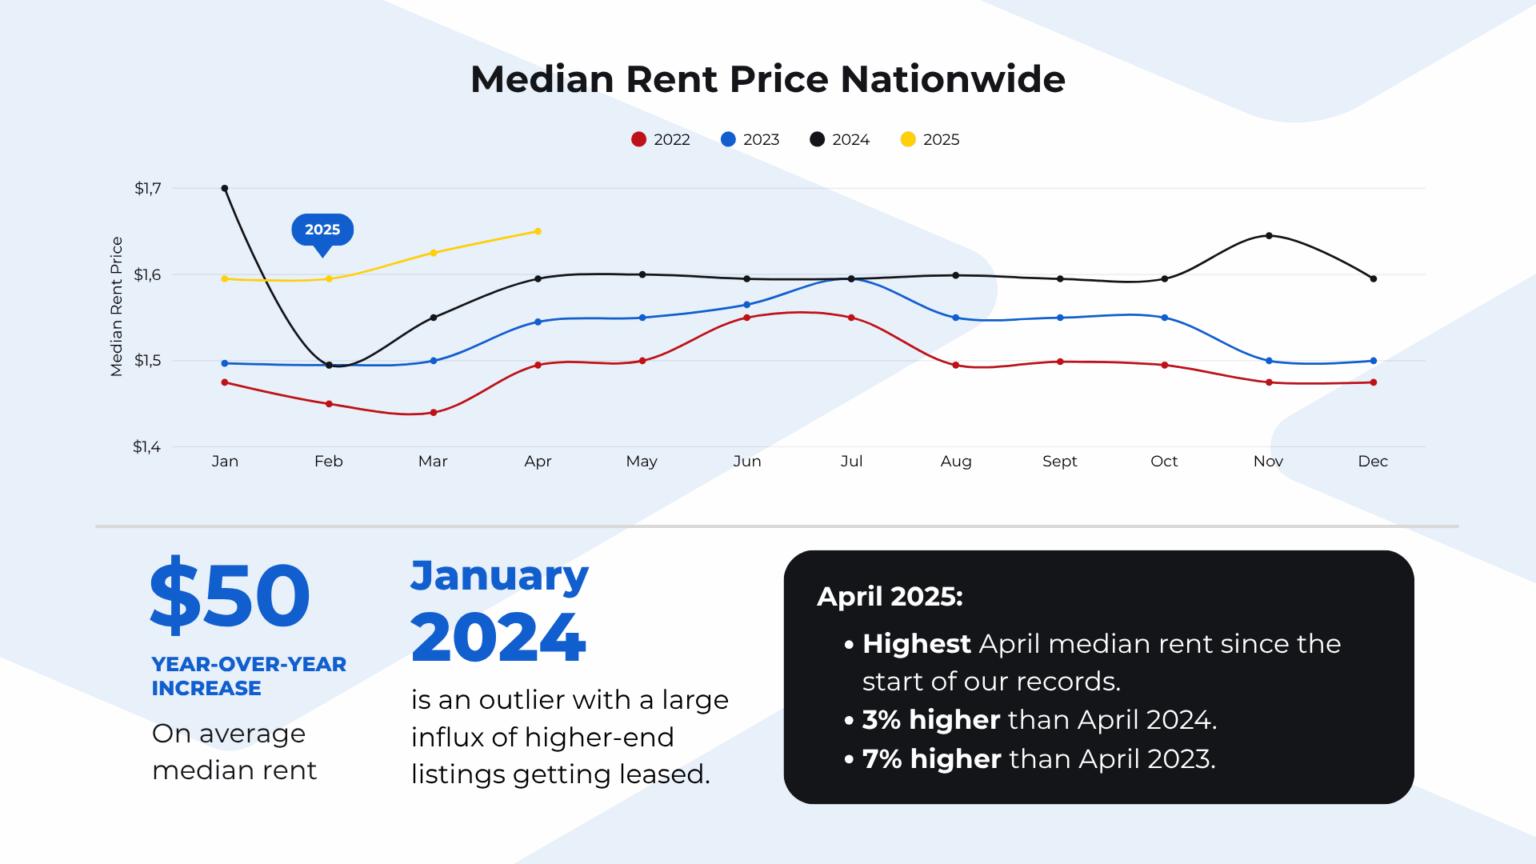
Figure 7: Median rent is rising nationwide
These increases reflect both constrained supply and our continued inflationary environment. Limited supply + inflationary pressure = upward pressure on housing and rental prices.
This is the main reason we see today’s market as one closer to what we considered normal pre-pandemic — vacancies around 5% (rather than the 2% vacancy during early pandemic months).
It’s also important to understand how these forces might shape the market moving forward. Right now, we’re seeing homebuyers paying over asking (and sometimes even over appraised value in many markets). While that may make financing that purchase difficult (a bank doesn’t want to lend more than the collateral's value), it can contribute to overall inflation.
When the next property in that neighborhood sells, the appraiser will comp the recently purchased home that sold above asking price, thereby pushing up the property’s appraised value.
That trickles down: landlords raise rents to cover their mortgage payments, and renters are less able to exit renting and move into homeownership because it just got more expensive.
Higher rents aside, however, today’s market is squeezing property managers and putting pressure on their margins. Let’s take a look at a few ways they can increase operational efficiency to maintain margins in this “new normal” market.
5 Tips for Increasing Efficiency as the Rental Market Normalizes
Ultimately, a more efficient operation gets units leased faster, saving time and money. To get there, property managers can standardize processes, remove friction from their day to day, and shift the work of leasing properties from their team to prospects.
Here are five specific techniques that let you do that.
1. Set the asking price right
The cost of setting the wrong asking price is ~30 days. Set your price too high, and you’ll lose a month’s rent (Figure 8).
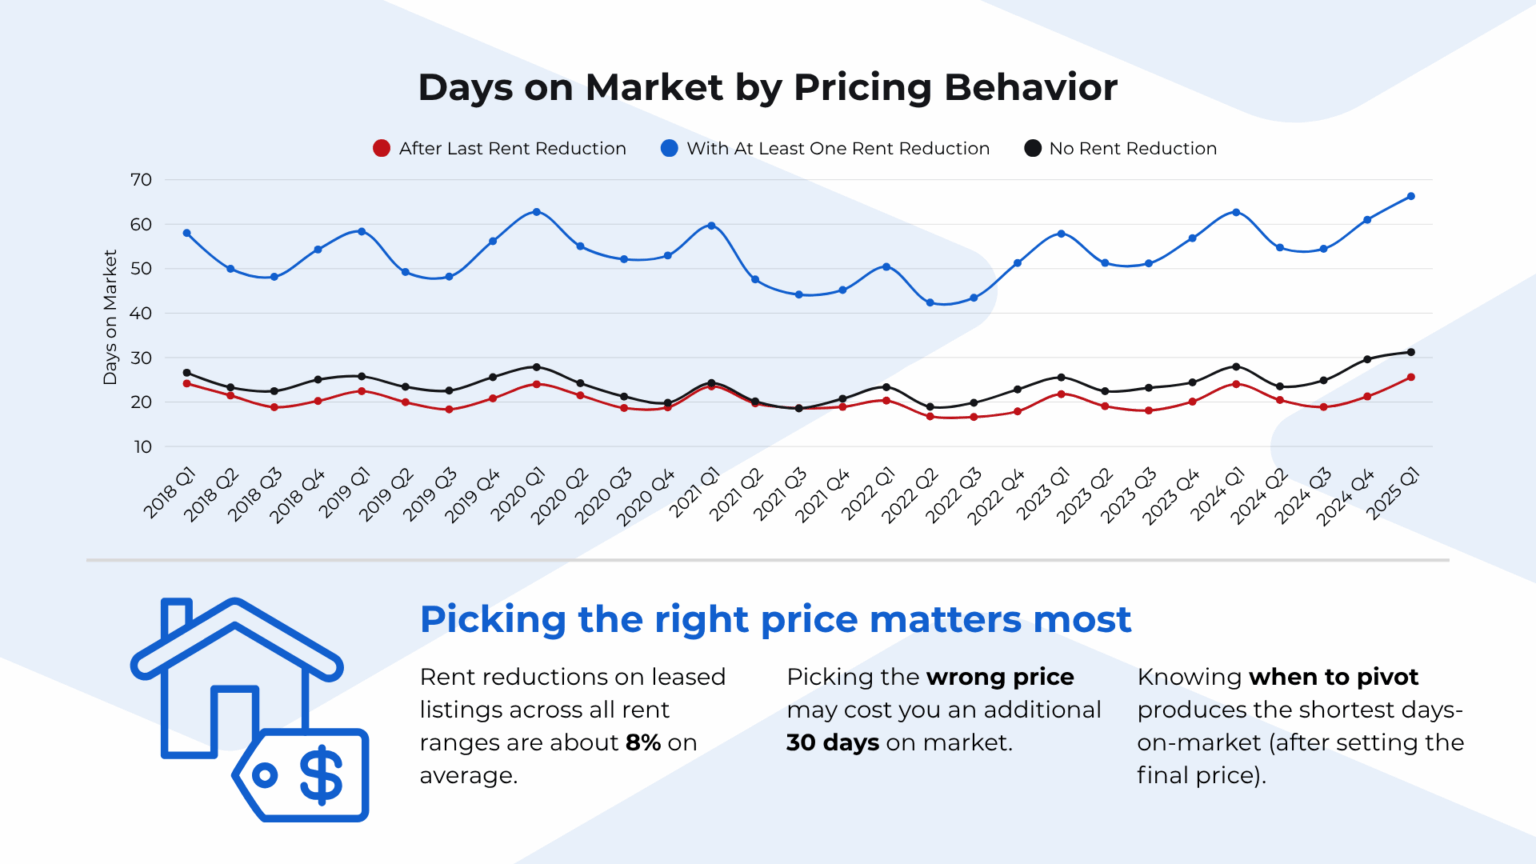
Figure 8: Setting prices too high costs ~30 days on the market
This means you need a process for setting prices. If you’re not spending time with comps right now — or if you’ve had to reduce rates recently — consider updating your process.
2. Include these 6 things in listings
The listing itself plays a big role in how quickly you lease a unit. But what works best? As of Q2 2025, the following six items lead to fewer days on the market:
Descriptive titles. Having no title costs you a day or two.
400+ word property description. With tools like ChatGPT at your fingertips, creating robust descriptions is easier than ever. There’s no reason not to include these, and longer descriptions show some advantage.
2 – 10 listing details. Mention things that differentiate your property (hardwood floors, stainless steel appliances, modern fixtures, a pool) rather than things that are standard.
Clear, transparent policies. As we mentioned above, there’s a penalty for being silent or unclear about your policy for pets (one day), security deposits (three to four days), or the application process. Spell these out every time to rent units quicker.
High-quality, watermarked photos. The number of photos doesn’t seem to affect time to lease, but quality, clean, professional photos likely do improve your chances of attracting tenants. Watermarks don’t affect time on market but using aggressive watermarks (Figure 9) reduces fraud by 40%.
Video or 3D tours. Only about 8% of listings have these as of Q2 2025, so we can’t make definitive claims about how they impact time on market. But as of now, they will help you stand out and reduce some applicant noise because they help with clarity about what you’re offering, especially for higher-end units.
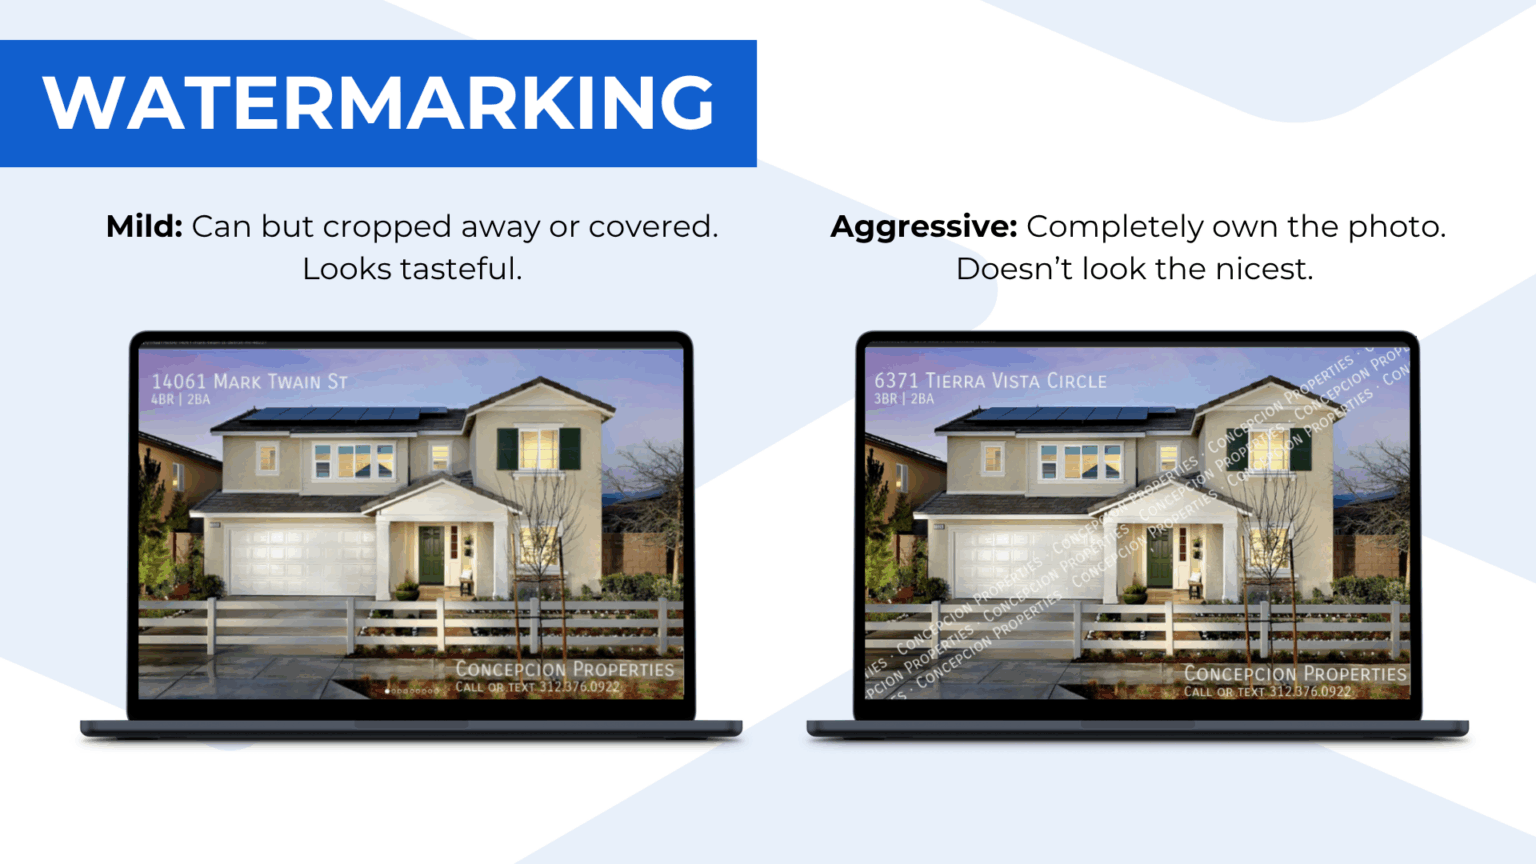
Figure 9: Aggressive watermarking reduces fraud by 40%
3. Allow real-time self-scheduling
62% of prospects browse listings in the evenings and on weekends. Rather than making them wait until staff is working the next day to get a response, empower them to self-schedule a showing.
This accomplishes two things: first, it eases the administrative Burden on your team. Second, it takes advantage of prospect interest when it’s highest rather than hoping they get to their email the next day.
When possible, maintain near-term availability for showings. The shorter the time between a booking and the actual tour, the higher the likelihood that the prospect will show (Figure 10).
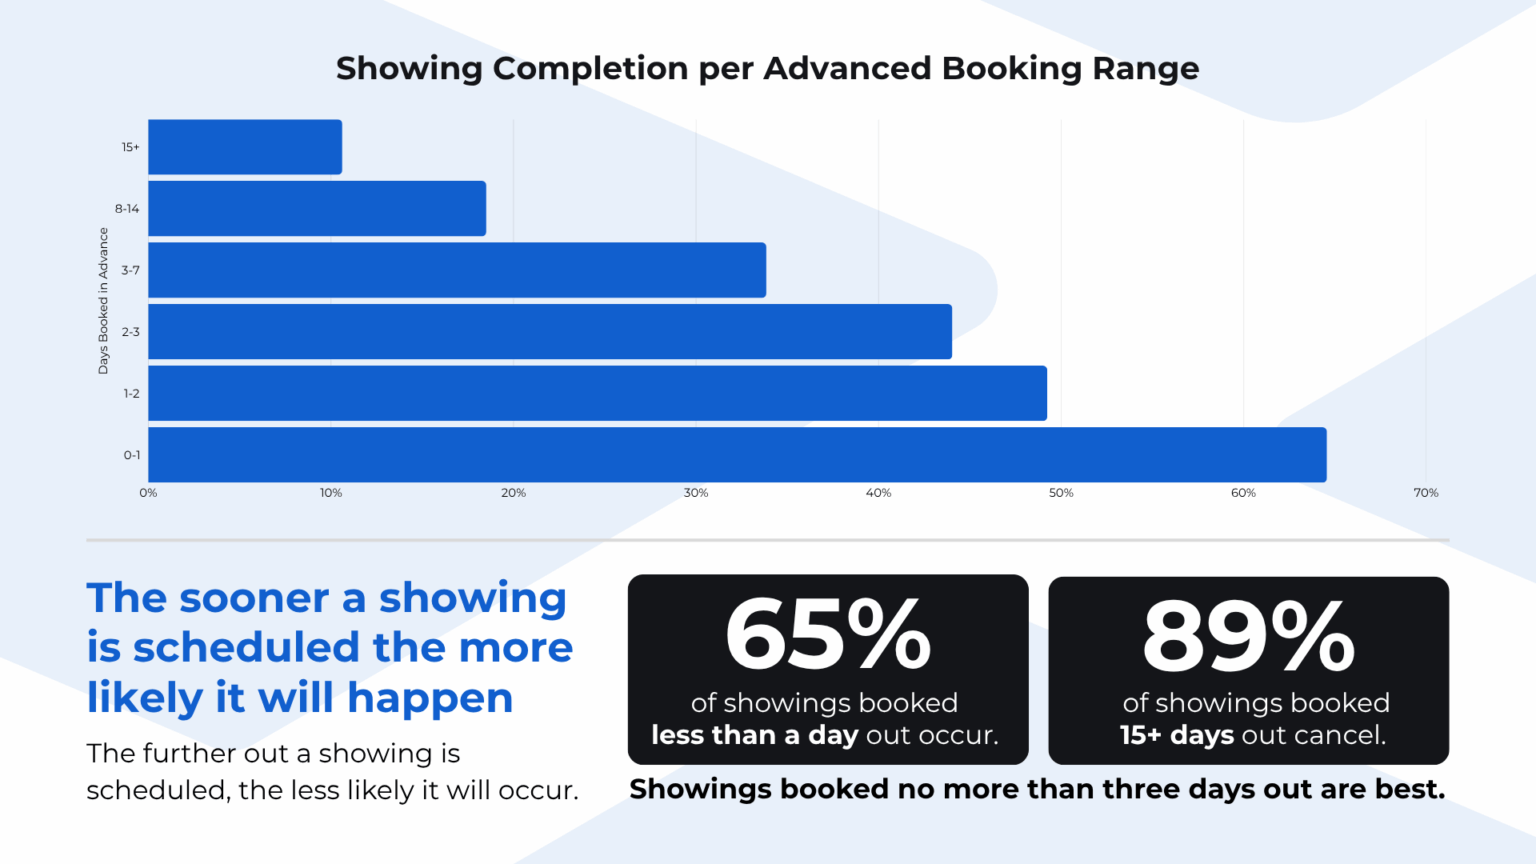
Figure 10: Prospects show up most for bookings scheduled 0 – 3 days out
4. Automate administrative processes
Self-scheduling is a big one. Live Answer, for example, is a service that answers the phone when you can’t. It also lets your agents work more efficiently: when they’re giving a showing, our team can answer incoming calls and give callers all the information they need.
Other processes you can automate with leasing automation software like ShowMojo:
Following up about showings via email and text to reduce no-shows
Following up with email summaries after a tour
Responding to leads in real time
The more you leverage purpose-built software, the less your admin team has to do — and the fewer people you need on payroll. Everyone on your team can work smarter, not harder, and your organization as a whole enjoys better margins.
5. Maximize foot traffic with self-guided tours
When you let prospects do self-guided tours, you’ll book about 20% more showings. If you’re not yet familiar with Self-Showings, they work like this: using a smart lockbox or smart lock, you empower prospects to access a unit at a specific time and view it at their convenience, without your staff present.
The benefit is, as we mentioned, more foot traffic.
There are risks, however. Personally, we wouldn’t be comfortable offering self-guided showings for an occupied unit. There is definitely efficiency to be gained here; the real question is what kind of risk you’re comfortable taking on.
For more information on the hard data backing these findings, please visit:
Posting article details is courtesy of Showmojo.