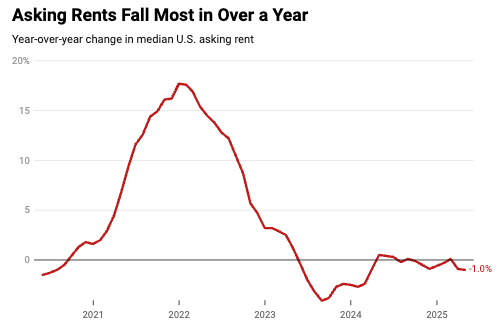
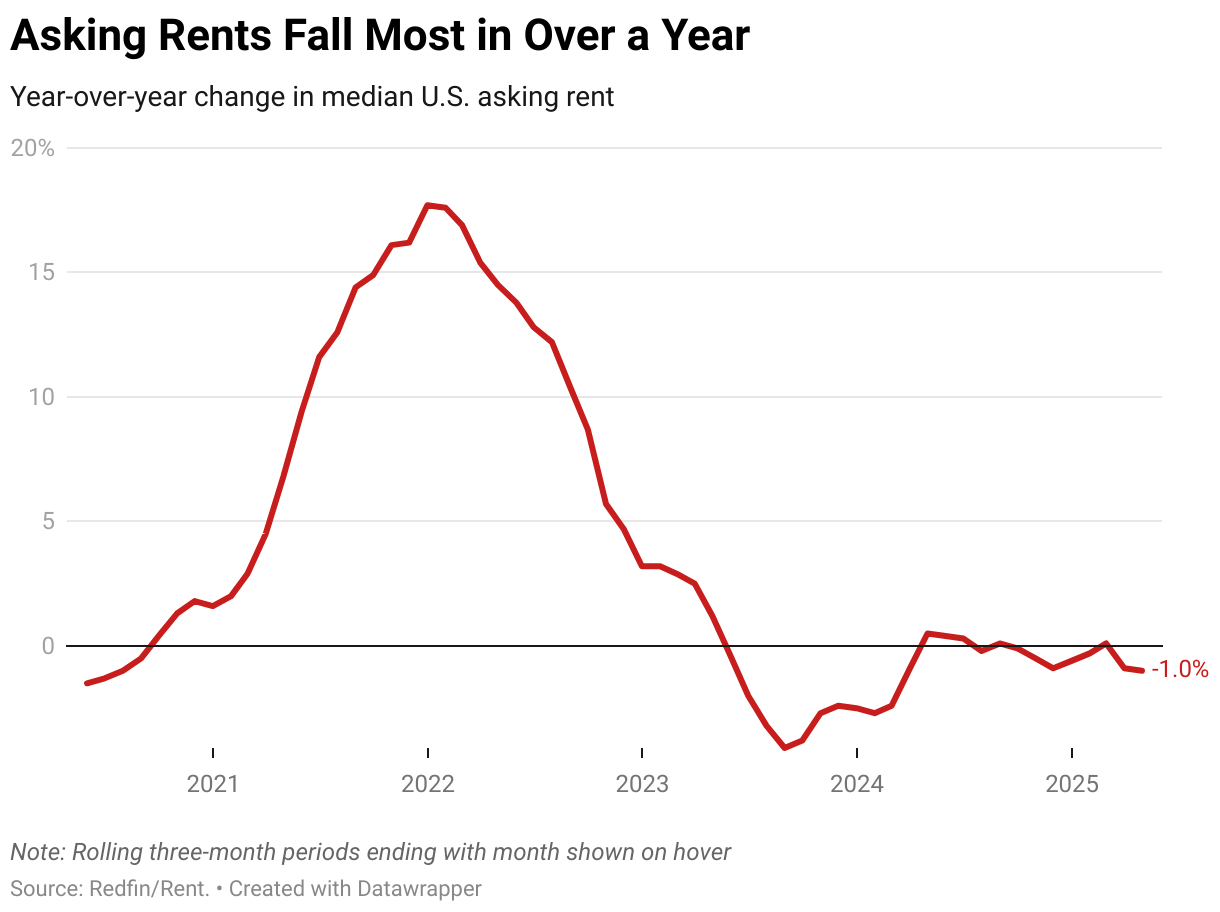
U.S. Rents Drop 1% in April, Biggest in 14 Months

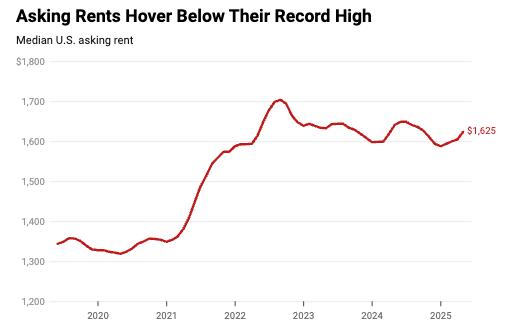
The median asking rent was $1,625, down $80 from the record high, as elevated apartment supply pushed rents lower. Asking rents fell fastest in Austin, down 10% year over year and $400 below the record high.
The median U.S. asking rent fell 1% year over year to $1,625 in April, marking the biggest decline since February 2024. That’s $80 below the August 2022 record high of $1,705.
Note: Rolling three-month periods ending with month shown on hover
Source: Redfin/Rent.Get the data Embed Download image  Created with Datawrapper
On a month-over-month basis, the median U.S. asking rent rose 1.2% in April—typical for this time of year.
“Asking rents are sluggish because there are more apartments for rent than people who want to rent them,” said Redfin Senior Economist Sheharyar Bokhari. “Renter demand is strong, but growth in apartment supply is even stronger because multifamily construction surged in the wake of the pandemic moving frenzy. Permits to build apartments have started to taper off, though, so asking rents could rebound in the coming months.”
The rental vacancy rate for buildings with five or more units was 8.2% in the first quarter—the most recent period for which data is available. That’s tied with the prior quarter for the highest level since early 2021. Less than half of newly built apartments are getting rented out within three months—one of the lowest shares on record. This helps explain why asking rents are declining in many areas.
But while asking rents fell last month, zooming out to a longer timeline paints a picture of stability. April marked the 14th-straight month in which asking rents barely decreased or increased, with a year-over-year change of 1% or less during each of those months. Those changes pale in comparison to the wild swings during the pandemic era, when asking rents jumped as much as 17.7% and fell as much as 4.1%.
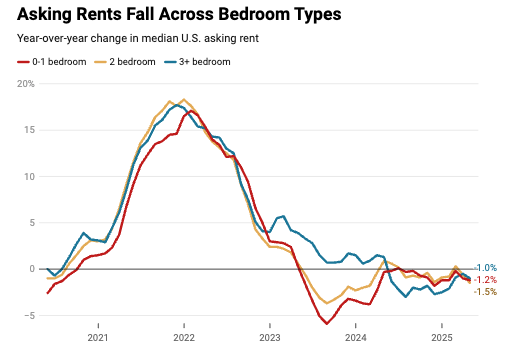
Asking Rents Are Falling Fastest for Two Bedroom Apartments
The median asking rent for 0-1 bedroom apartments fell 1.2% year over year to $1,481. For 2 bedroom apartments, it decreased 1.5% to $1,699—the largest decline since February 2024. And for 3+ bedroom apartments, it fell 1% to $1,999.
Note: Rolling three-month periods ending with month shown on hover
Source: Redfin/Rent.Get the data Embed Download image   Created with Datawrapper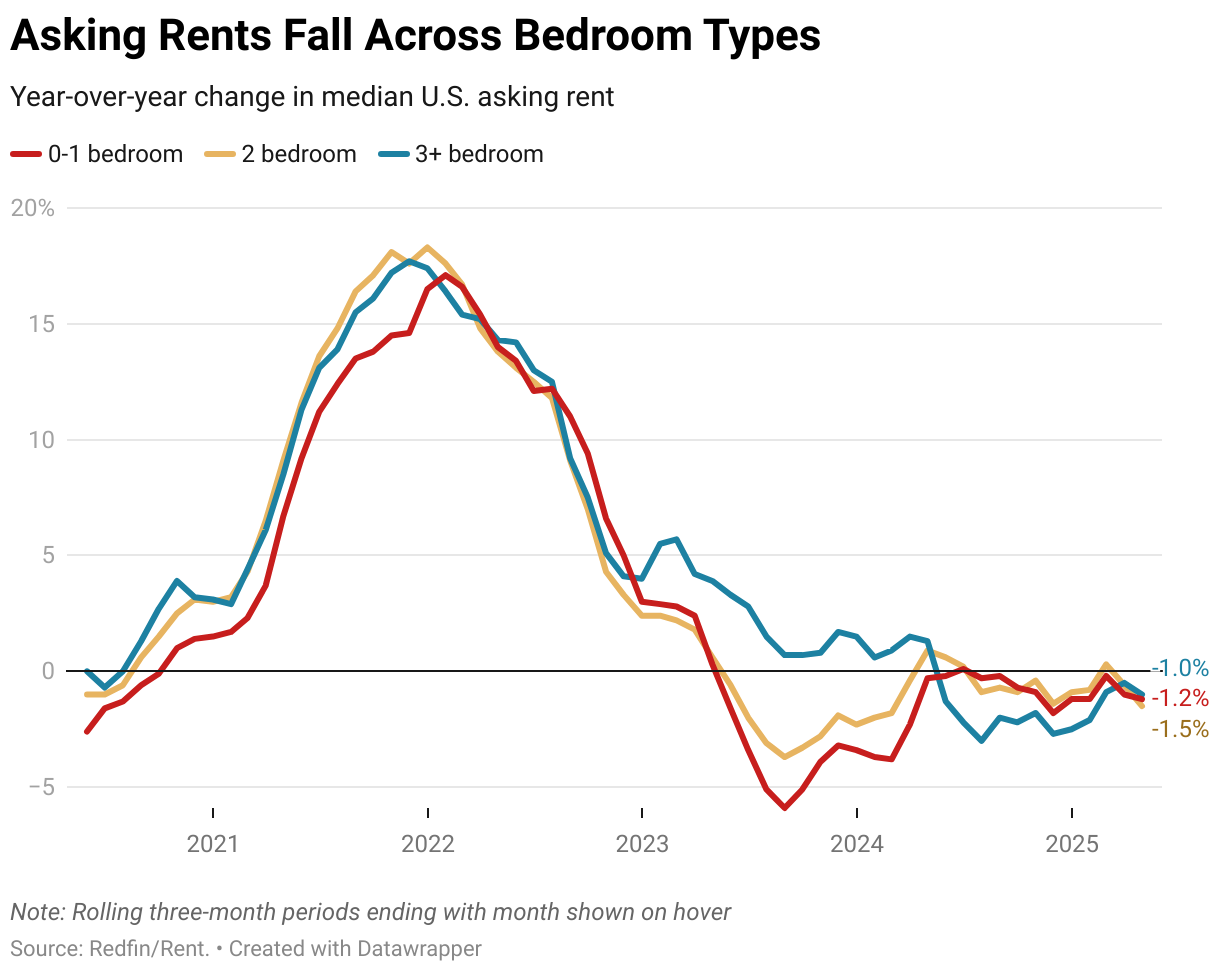
Metro-level summary: three months ending April 30, 2025
The table below includes 44 of the 50 most populous U.S. CBSAs—those for which Rent. and Redfin have sufficient rental data.
| Core-based statistical area (CBSA) | Median asking rent | MoM change | YoY change | Median rent / sq ft | MoM change / sq ft | YoY change / sq ft |
|---|---|---|---|---|---|---|
| Atlanta-Sandy Springs-Alpharetta, GA | $1,542 | 0.7% | -0.9% | $1.59 | 0.9% | -2.8% |
| Austin-Round Rock-Georgetown, TX | $1,399 | -1.5% | -9.6% | $1.66 | -0.6% | -1.8% |
| Baltimore-Columbia-Towson, MD | $1,615 | 0.5% | 5.9% | $1.75 | 0.2% | 3.8% |
| Birmingham-Hoover, AL | $1,418 | 2.2% | 5.8% | $1.32 | 1.0% | 2.5% |
| Boston-Cambridge-Newton, MA-NH | $2,834 | 1.9% | 2.3% | $3.41 | 2.9% | 2.7% |
| Buffalo-Cheektowaga, NY | $1,310 | 0.4% | 2.3% | $1.68 | 0.6% | -1.0% |
| Charlotte-Concord-Gastonia, NC-SC | $1,504 | 0.4% | 0.3% | $1.59 | 0.5% | -1.7% |
| Chicago-Naperville-Elgin, IL-IN-WI | $1,772 | 1.1% | 3.3% | $2.25 | 0.7% | 5.1% |
| Cincinnati, OH-KY-IN | $1,450 | 0.6% | 8.7% | $1.61 | 2.1% | 3.9% |
| Cleveland-Elyria, OH | $1,290 | -0.8% | 2.1% | $1.49 | 0.0% | 4.1% |
| Columbus, OH | $1,421 | 0.4% | -2.5% | $1.59 | 1.4% | 0.3% |
| Dallas-Fort Worth-Arlington, TX | $1,480 | 1.8% | -2.2% | $1.75 | 0.8% | -3.2% |
| Denver-Aurora-Lakewood, CO | $1,749 | 2.0% | -2.6% | $2.09 | 0.9% | -6.8% |
| Detroit-Warren-Dearborn, MI | $1,395 | 1.5% | 0.6% | $1.57 | 0.9% | 3.3% |
| Houston-The Woodlands-Sugar Land, TX | $1,250 | 0.4% | -1.2% | $1.44 | 0.2% | -3.1% |
| Indianapolis-Carmel-Anderson, IN | $1,401 | -0.3% | -2.1% | $1.54 | 0.7% | 0.4% |
| Jacksonville, FL | $1,490 | 1.0% | -3.6% | $1.56 | 0.8% | -0.5% |
| Las Vegas-Henderson-Paradise, NV | $1,500 | 0.1% | -1.3% | $1.64 | 0.1% | -2.5% |
| Los Angeles-Long Beach-Anaheim, CA | $2,753 | 0.1% | -2.2% | $3.39 | 0.7% | 0.9% |
| Louisville/Jefferson County, KY-IN | $1,270 | 0.0% | -1.2% | $1.40 | 1.3% | 1.3% |
| Memphis, TN-MS-AR | $1,260 | 0.8% | -0.9% | $1.29 | 1.2% | -1.5% |
| Miami-Fort Lauderdale-Pompano Beach, FL | $2,425 | 0.7% | -1.3% | $2.59 | 1.8% | 3.5% |
| Minneapolis-St. Paul-Bloomington, MN-WI | $1,530 | 0.1% | -7.3% | $1.91 | 0.5% | -6.7% |
| Nashville-Davidson-Murfreesboro-Franklin, TN | $1,546 | 0.3% | -3.0% | $1.71 | -0.4% | -0.7% |
| New York-Newark-Jersey City, NY-NJ-PA | $2,845 | 0.2% | -3.4% | $3.58 | 0.3% | -0.1% |
| Orlando-Kissimmee-Sanford, FL | $1,745 | 0.3% | -3.2% | $1.79 | 0.0% | -5.5% |
| Philadelphia-Camden-Wilmington, PA-NJ-DE-MD | $1,910 | 1.3% | 0.6% | $2.34 | 3.5% | 2.4% |
| Phoenix-Mesa-Chandler, AZ | $1,483 | 0.6% | -3.3% | $1.80 | 0.5% | -1.4% |
| Pittsburgh, PA | $1,499 | 1.6% | 7.5% | $1.76 | 1.2% | 4.1% |
| Portland-Vancouver-Hillsboro, OR-WA | $1,795 | 1.8% | -5.3% | $2.12 | 5.1% | -1.1% |
| Providence-Warwick, RI-MA | $2,185 | 0.7% | 2.2% | $2.63 | 0.7% | 5.2% |
| Raleigh-Cary, NC | $1,450 | 1.5% | -5.2% | $1.55 | 1.4% | -2.8% |
| Richmond, VA | $1,599 | 0.8% | -0.7% | $1.77 | 1.4% | -3.0% |
| Riverside-San Bernardino-Ontario, CA | $2,333 | 0.1% | 0.9% | $2.62 | 0.8% | -0.2% |
| Sacramento-Roseville-Folsom, CA | $2,050 | 1.7% | 1.5% | $2.37 | 0.8% | -2.0% |
| Salt Lake City, UT | $1,552 | 2.2% | -3.5% | $1.96 | 5.6% | -2.0% |
| San Diego-Chula Vista-Carlsbad, CA | $2,719 | 1.6% | -5.2% | $3.28 | 1.9% | -4.3% |
| San Francisco-Oakland-Berkeley, CA | $2,737 | 1.6% | -2.8% | $3.58 | 1.5% | -4.1% |
| San Jose-Sunnyvale-Santa Clara, CA | $3,284 | 1.7% | 1.8% | $3.87 | 2.1% | 5.1% |
| Seattle-Tacoma-Bellevue, WA | $2,054 | 0.0% | -0.6% | $2.72 | -0.2% | -4.8% |
| St. Louis, MO-IL | $1,290 | 1.3% | 1.0% | $1.46 | 0.6% | -0.1% |
| Tampa-St. Petersburg-Clearwater, FL | $1,803 | 0.7% | 2.6% | $1.97 | 1.1% | -0.5% |
| Virginia Beach-Norfolk-Newport News, VA-NC | $1,568 | 0.6% | 1.6% | $1.69 | 0.3% | 2.9% |
| Washington-Arlington-Alexandria, DC-VA-MD-WV | $2,090 | 1.6% | 5.2% | $2.39 | 1.3% | 3.9% |
| United States of America | $1,625 | 1.2% | -1.0% | $1.82 | 0.8% | -1.3% |
Methodology
Median asking rents in this report cover newly listed units in apartment buildings with 5 or more units. The median is calculated over a rolling three-month period; i.e., the median asking rent for April 2025 covers rentals listed on Rent.com and Redfin.com during the three months ending April 30, 2025.
Metro-level data in this report cover 44 of the 50 most populous U.S. core-based statistical areas (CBSAs)—those for which Rent. and Redfin have sufficient rental data. The national figures are based on data for the entire U.S.
Asking rents reflect the current costs of new leases during each time period. In other words, the amount shown as the median asking rent is not the median of what all renters are paying, but rather the median asking price of apartments available to new renters during the report period.